Alphabet (Google) $GOOG $GOOGL reported 1Q 2021 earnings yesterday. The results were significantly above both street estimates and guidance.
Alphabet $GOOG reported Q1 2021 EPS of $26.29, $10.41 better than the analyst estimate of $15.88. Revenue for the quarter came in at $55.31B versus the consensus estimate of $51.68B
$GOOG has outperformed $MSFT last year and so far this year
$GOOG saw strong growth in YouTube, Cloud and accelerating search revenue. I believe this might be one of the best Covid recovery plays along with $FB.
Strong 34% growth in Revenue
Google Cloud and YouTube segment revenue growth stayed above 45% YoY.
$GOOG repurchased $7.9B worth of shares; repurchased ~$76bn worth of shares in the past 4 years; $GOOGL board authorized another $50B buyback.
Cloud: Revenue increased 46% YoY, and backlog increased to vs. ~$30B in 4Q vs. $19bn in 3Q.
Analyst Price Targets (PT) upgrades
PT Raised to $2,850 at Jefferies PT Raised to $2,800 at Canaccord Genuity PT Raised to $2,635 at Piper Sandler PT Raised to $2,700 at Cowen PT Raised to $2,575 at Morgan Stanley PT Raised to $2,700 at Needham & Company PT Raised to $2,750 at Raymond James
$ZIP ZipRecruiter is an online marketplace for jobs. ZipRecruiter works like a matchmaker curating job opportunity for job seekers, and candidates for employers.
$ZIP is planning to go IPO via direct listing sometime in Q2 2021.
Background
The company was founded in 2010 by Ian Siegel Joe Edmonds, Ward Poulos and Will Redd in Santa Monica, California. The company’s investors include venture capital firms IVP and Basepoint Ventures.
$ZIP has raised more than $250M in funding and was previously valued at $1.5B in 2019.
Market
Employers spend more than $205B per year in the United States alone to recruit talent.
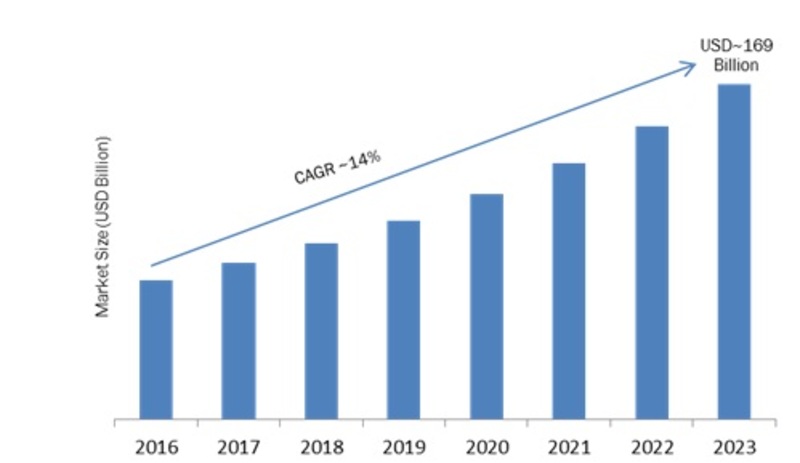
Global online recruitment market
Online recruitment alone represents over $13 billion of this opportunity. The online segment of the U.S. recruiting market is expected to grow at a compound annual growth rate, or CAGR, of 14.1% from 2016 to 2025.
The online segment of the recruiting market in the U.S. is expected to continue expanding its share of the recruiting market, with online share increasing from 3% in 2016 to 6% in 2020 and to 8% in 2025.
Industry
ZipRecruiter has competition in LinkedIn, Indeed, as well as from many well-established online job sites such as CareerBuilder, Craigslist, Glassdoor, and Monster and may face additional competition from Google for Jobs or Facebook.
ZipRecruiter has <2% share
Product
Jobs posted with ZipRecruiter are distributed to well over 1,000 career sites.
When employers post a job, ZipRecruiter’s matching technology identifies and sends an alert to the best job seekers in $ZIP
$ZIP provides employers with access to 14M monthly Active Job Seekers.
Key Innovations from $ZIP
Customers
Roughly about 2.8 M employers and 110M job seekers use $ZIP
$ZIP experiences a decline in the Paid Employers during the fourth quarter as a result of seasonal hiring dynamics.
The number of Quarterly Paid Employers December 31, 2019 declined by 9% as compared to the quarter ended September 30, 2019.
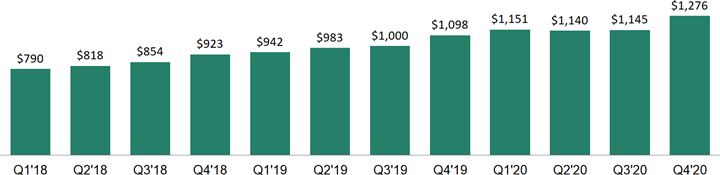
In 2020, $ZIP experienced a decrease in sequential revenue of 23% in the quarter ended June 30, 2020 as a result of the COVID-19 pandemic, but saw consecutive quarters of revenue growth of 17% and 11% in the third and fourth quarters of 2020 as employers started to return.
Revenue in the second half of the year represented 52% of total annual revenue in 2018, 2019 and 2020.
The average customer spends about $1200+ each year.
$ZIP provides a variety of pricing plans from flat rate pricing on terms ranging from a day to a year, as well as performance-based pricing for employers that run sophisticated recruitment marketing campaigns.
$ZIP subscription revenue consists of time-based job posting plans, upsells which complement or expand visibility and prominence to job posting plans, and resume database plans.
Go to Market
Customer payback period averaged less than 16 months, meaning that the Cohort’s Employer Acquisition Expense was, on average, recovered within 1.5 years.
$ZIP spends money on marketing campaigns and has an inside sales team.
Management
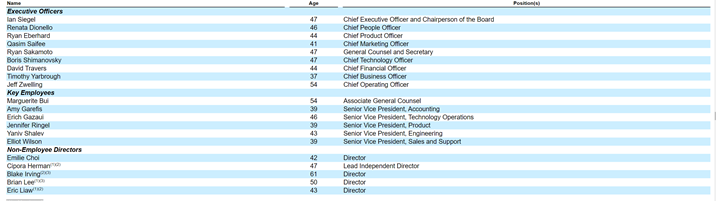
ZipRecruiter is run by a seasoned management team with average tenure of about 24 months at $ZIP
Financials
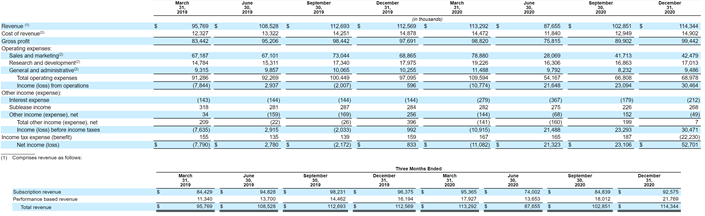
Last year, it had net income of $86M on revenue of $418M , compared with a net loss of $6.3M on revenue of $430M in 2019.
Revenue slowed because of Covid but they turned a profit.
The company was worth $1.5 billion in a 2018 fundraising round. ZipRecruiter is expected to list the IPO at between $3B and $5B in valuation.
The company hired Goldman Sachs Group Inc and JPMorgan Chase & Co to lead in the preparations for the IPO.
Valuation
At $3B – $5B in valuation, with expected 20% growth the company is valued at 7X to 12X 2020 revenues.
Recommendation
While this is an interesting company, I am going to wait for 6-9 months until after the IPO and 2 quarters of execution before I even take a position (or not).
$KNBE Knowbe4 (Know Before) is a Security Training and awareness SaaS company that went public last week.
$KNBE was founded in 2010 by Stu Sjouwerman in Tampa Florida and has famed hacker Kevin Mitnick on board as well.
$KNBE listed at $16/share, raising $201 Million at a valuation of $2.4B for the company, which recorded $174.8M in 2020 revenues growing at 45% YoY.
The company has over 37K customers paying over $4000 per year to provide security training services, which prevent attacks such as data breaches and speak phishing.
$KNBE has a 3 steps process to train users, simulate attacks and review results to ensure compliance. They also provide free tools to test users and network which help to identify the problems of social engineering, spear phishing and ransomware attacks.
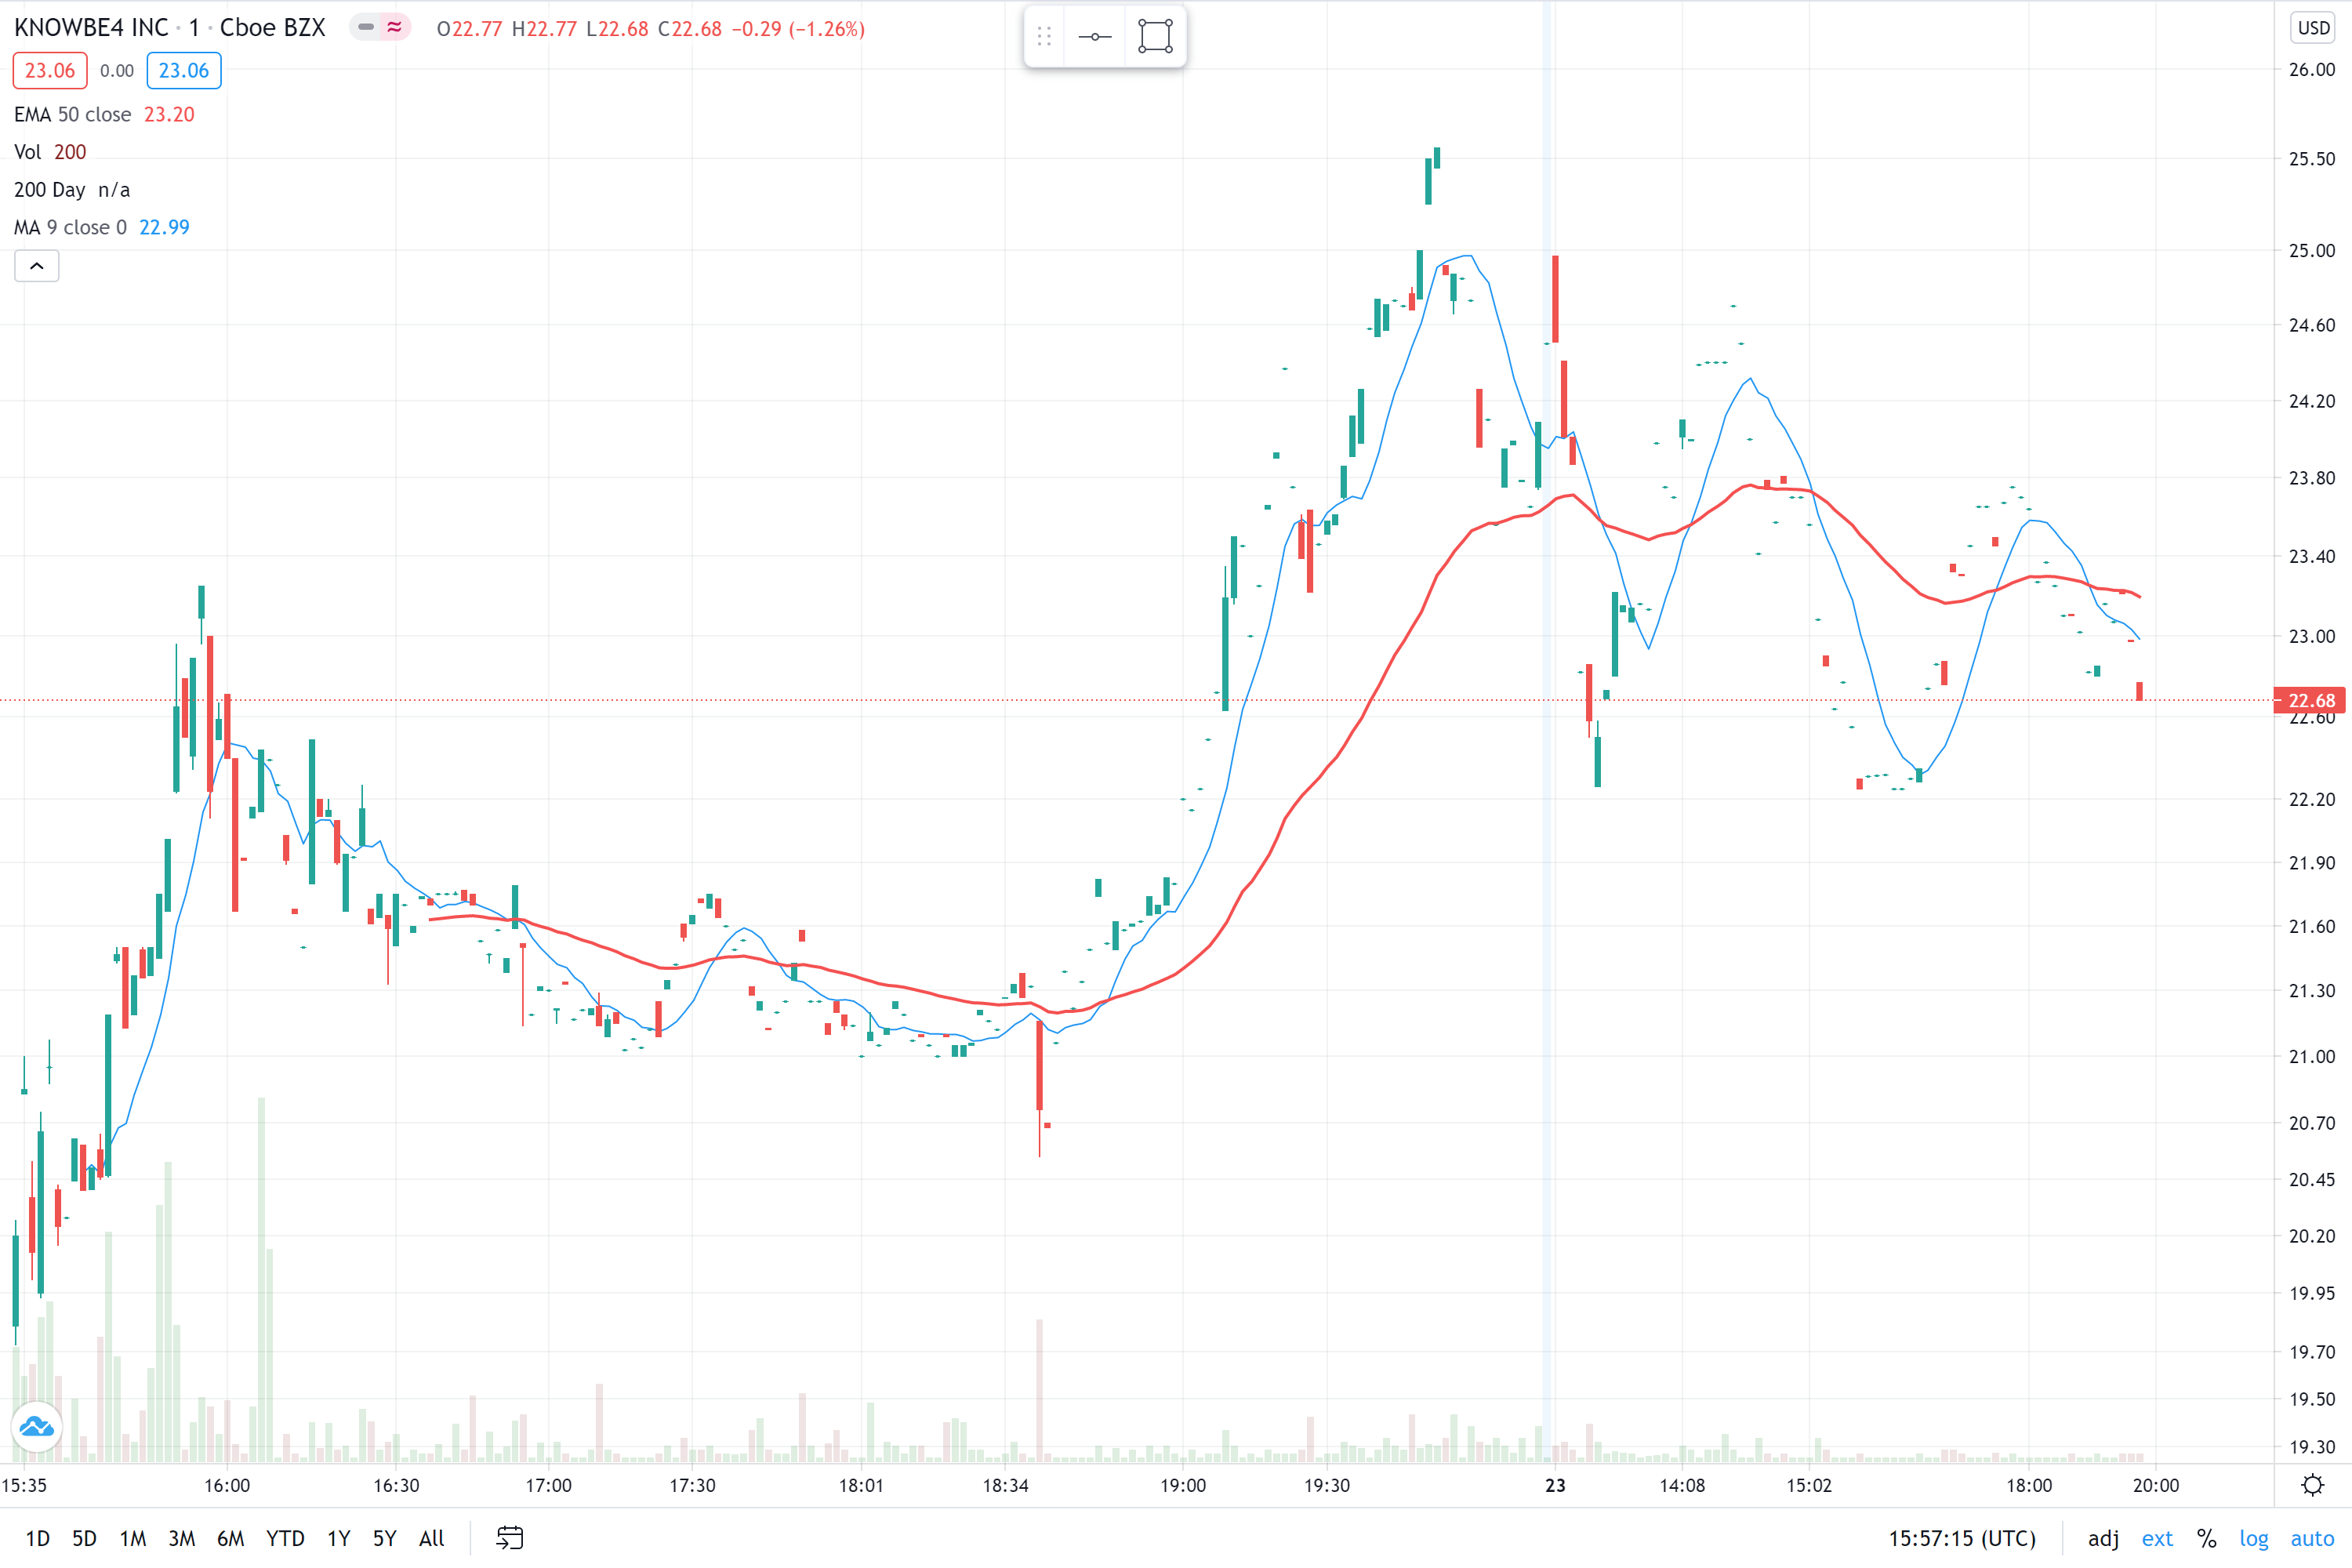
$KNBE opened at $19.95 per share Thursday, above expectations, and peaked at $25.94 shortly before closing at $24.14. At the highest price, the company’s was worth nearly $4.3B
$KNBE saw revenues of $174.9M in 2020, up from $120.6M in 2019 and $71.3M in 2018. It did not, however, turn a profit in any of those years. Last year’s net loss was $2.4M a dramatically lower number than the $125M loss the year earlier.
$KNBE has 84%+ gross margins and will be on track to be EBITDA positive by 2021 end (estimated).
$KNBE has been mentioned as a leader in the Forrester wave for Security awareness and training solutions.
The market for Security awareness and training is about $1B annually, growing at 7% CAGR and is expected to be at $1.9B by 2025.
There are multiple players in the market, including KnowBe4, Webroot, Infosec IQ, Inspired eLearning, Proofpoint $PFPT, The Defence Works, SANS, Symantec, and Ataata.
$KNBE has received at least $158M from investors including Elephant Partners, KKR, Goldman Sachs, Tiger Global, Vista Equity Partners and Kevin Mitnick.
$KNBE has a direct sales force as well as channel partners (drive 37% of revenues) and managed service providers.
Metrics: Average revenue per customer is about $4700 (+17% YoY), while rule of 40 is at 44. DBNER and CAC were not provided in the SEC filings, so it is hard to compare $KNBE to other providers in SaaS.
Valuation: At 22X 2020 revenues and 15X 2021 revenues, $KNBE is richly valued, while growing at 40%-45%.
Recommendation: I am adding $KNBE to my watchlist but not buying yet. I expect the company to base for 3-6 months ($20 – $30 per share until Jun / Aug 2021). I would watch 2 Quarters of public performance closely to give us an indication if this is worth buying.
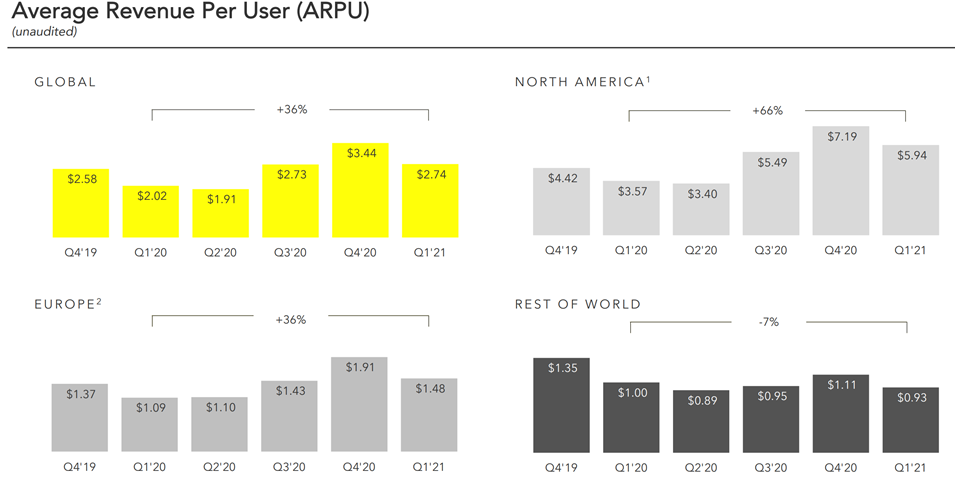
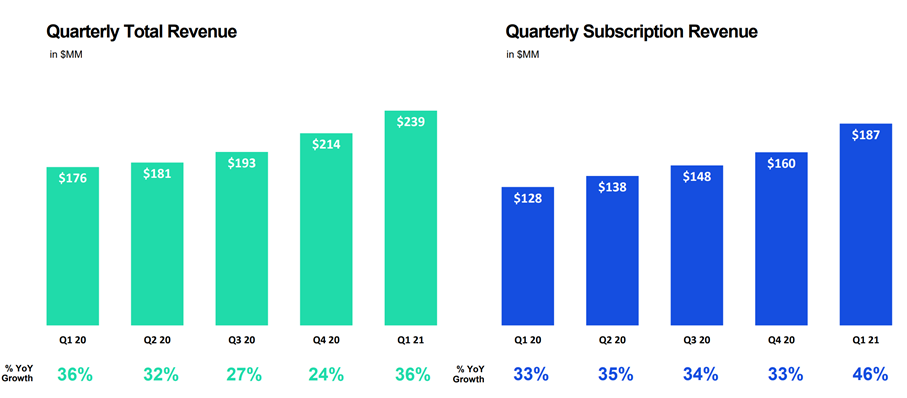
I wrote about Qualtrics $XM a few weeks ago and recommended an initial position at about $32 / share. Yesterday the company announced Q1 2021 earnings. Here is an update and earnings summary.
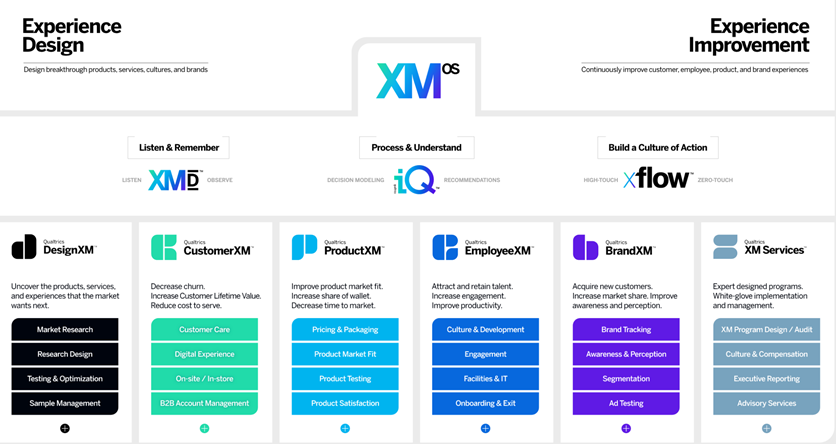
Qualtrics Experience Platform
Highlights
Q1 2021 Total Revenue of $238.6M, up 36% Year-over-year
Strong 36% revenue growth rate
DBNER (Dollar based net retention) was at 120%(constant), while customers spending more than $100K grew to 1,457 from 1338 in the previous quarter.
Margins remained steady at 77.2% (Subscription Margin is 90%).
Subscription revenue for the first quarter was $186.9 million, up from $128.3 million one year ago, an increase of 46% year-over-year.
Operating loss was $(196.6) million, compared to $(36.9) million one year ago.
The won several new customers from $APTV (Aptiv) and $DOCU (Docusign) to $TDOC (Teledoc) and $RCL (Royal Caribbean Cruise Lines)
New customer wins
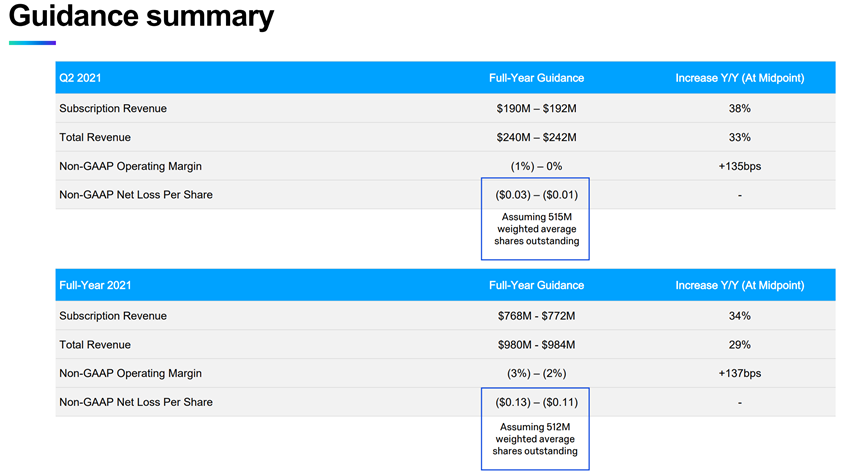
Strong guidance for Q2 and year
Q2 2021: Total revenue between $240M and $242M (+30% YoY), up from $239M previously.
EPS (Loss per share actually of $0.01 – $0.03 (vs $0.04 previously).
Annual 2021: Total revenue between $980M and $984M (+29% YoY) up from $950 M previously.
Netflix $NFLX reported Q1 EPS of $3.75, $0.78 better than the analyst estimate of $2.97.
Revenue for the quarter came in at $7.16 billion (+24% YoY) versus the consensus estimate of $7.13 billion.
NFLX key metrics and Q1 2021 performance
Paid subscriber net additions were 3.98 million versus the guidance of 6 million. Total paid memberships (cumulative) were 208 Million (+14% YoY).
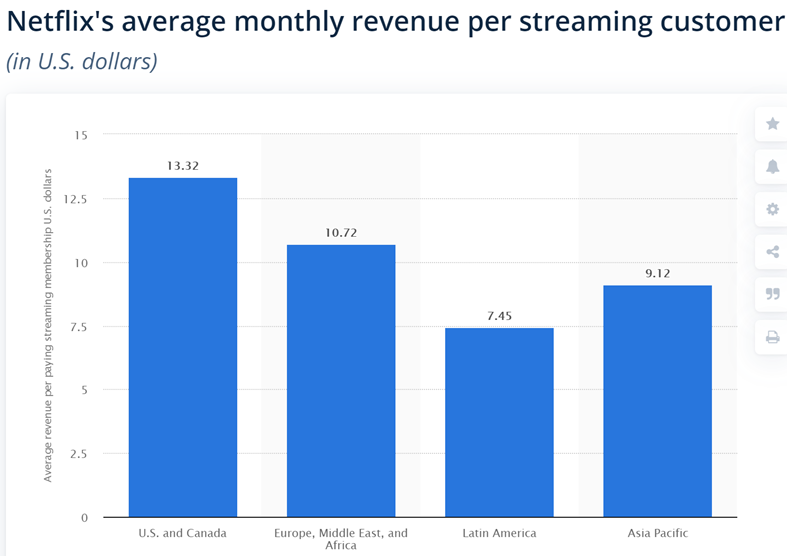
Average revenue per membership rose 6% year over year, or 5%, excluding a foreign exchange impact of +$80m.
Net cash generated by operating activities in Q1 was $777 million vs. $260 million in the prior year period.
Free cash flow (FCF) for the quarter was $692 million vs. $162 million in Q1‘20. We are on track for full year 2021 free cash flow to be approximately break even.
As we discussed last quarter, we believe we are very close to being sustainably FCF positive and that we no longer have a need to raise externalfinancing to fund our day-to-day operations.
$NFLX Guidance:
$NFLX sees Q2 subscriber paid net additions of 1 million, versus the consensus of 4.4 million.
$NFLX sees Q2 revenue of $7.3 billion, versus the consensus of $7.39 billion.
$NFLX sees Q2 EPS of $3.16, versus the consensus of $2.68.
Regional breakdown by region for Netflix subscribers
Double Verify $DV is a software company that ensures brand safety an detects digital advertising fraud for brands. DV was founded in 2008 by Alex Liverant and Oren Netzer in New York.
The company has about 650 employees and was acquired in 2017 by Providence Equity Partners.
Double Verify Ad Tech IPO on April 22, 2021
$DV provides online media verification and campaign effectiveness solutions for brand marketers, agencies, advertising networks, demand-side platforms, exchanges, and digital publishers looking to ensure quality advertising environments, campaign transparency, and performance.
DV is a unified service and analytics platform for Ad optimization
The marketing analytics software market was an estimated $2.7 billion in 2019 and is expected to reach $8 billion by 2027.
Advertising Marketing Analytics Market
$DV technology platform provides advertisers with data and analytics that can be used to optimize the quality and return on digital ad investments.
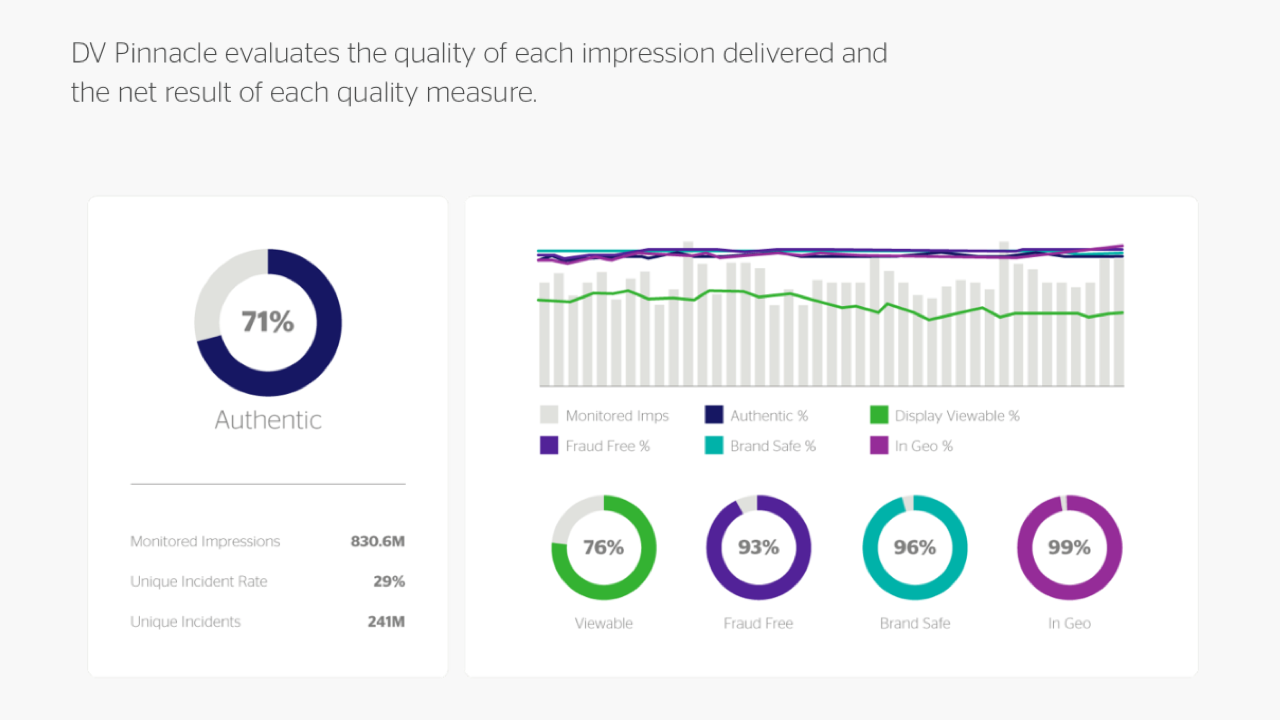
DV Pinnacle
$DV is raising $330M at the IPO, selling about 13 million shares on Thursday, April 22nd, 2021 for between $24 – $27 per share, implying a Market Cap of $4B – $4.5B, with 170M shares outstanding.
$DV CEO Mark Zargoski
$DV has grown well through the pandemic, growing 34% to $244M in revenue from $183M in 2019. Is has 30% EBIDTA margins and recorded $79M in 2020. It grew from $104M in 2018 (+74% YoY).
DV Revenue Growth
$DV generates revenue in three ways:
$DV (1) Advertiser – Direct (44% of rev) Advertisers can purchase services to measure the quality and performance of ads
$DV (2) Via Demand Side or Advertiser – Programmatic (48% of rev) – Advertisers can purchase its services through programmatic platforms
$DV (3) Via Supply Side (9% of rev) – Supply Side Platforms use data analytics to validate the quality of their ad inventory and provide data to their customers.
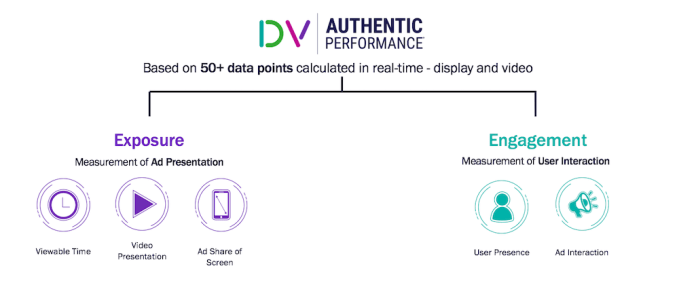
DV Exposure and Engagement
$DV raised funding from investors including Blumberg Capitaland IVP.
Providence Equity Partners acquired a majority stake in DoubleVerify in 2017, and the company most recently raised a $350 million private equity round led by Tiger Global Management in October 2020.
The company counts more than 1,000 advertisers and partners on its platform.
DV partnerships
$DV competes with companies like Improvely, Integral Ad Science and Forensiq in the analytics and ad fraud detection space.
$DV IPO pricing range implies approx. 8.5x to 10.0x on 22E revenue and 27.0x to 31.0x ‘22E EBITDA.
$DV has partnerships with $TTD (Trade Desk), $GOOG (Google), $AMZN (Amazon), $ROKU (Roku) and $FB (Facebook), $SNAP (Snap), $TWTR (Twitter) and $PINS (Pinterest).
$DV and $SNAP
I am going to pass on this opportunity for now, but keep it on my radar for a few more months. Other companies to track include $MGNI (Magnite), $PUBM (Pubmatic) and $KBNT (Kubient) in the same space.
Alight a HR, payroll, health outsourcing company, which was a part of AON was sold to Blackstone in 2017 for $4.3B. It was recording $2.0B in revenue in 2017 and today has grown to $2.6B – growing 30% over 3 years and 6% in 2020.
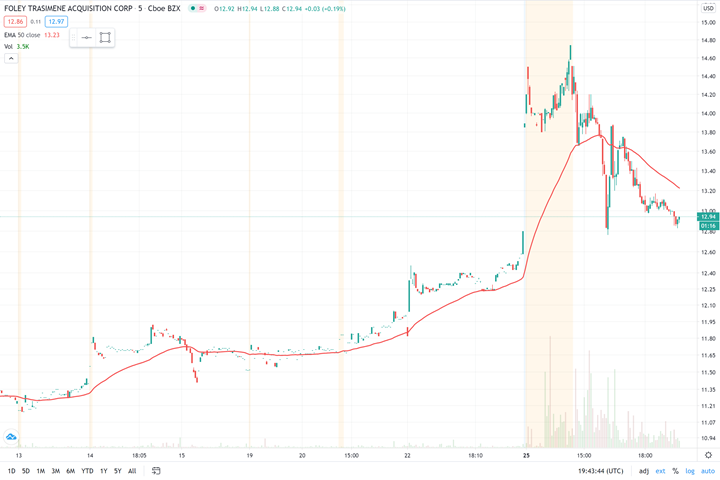
Today Foley Trasimene Acquisition Corp ($WPF) announced a SPAC merger to take the company public with a valuation of $7.3B
WPF Foley Trasimene Stock performance
I am going to pass on investing in this company. While the valuation is attractive (2.8X 2020 Revenue), and they have many F1000 customers as clients, the slow growth, combined with a largely low margin outsourcing business that has grown via acquisitions and still delivered little incremental value to justify the growth in EV/Rev from 2.15 in 2017 to 2.81 in 2020.
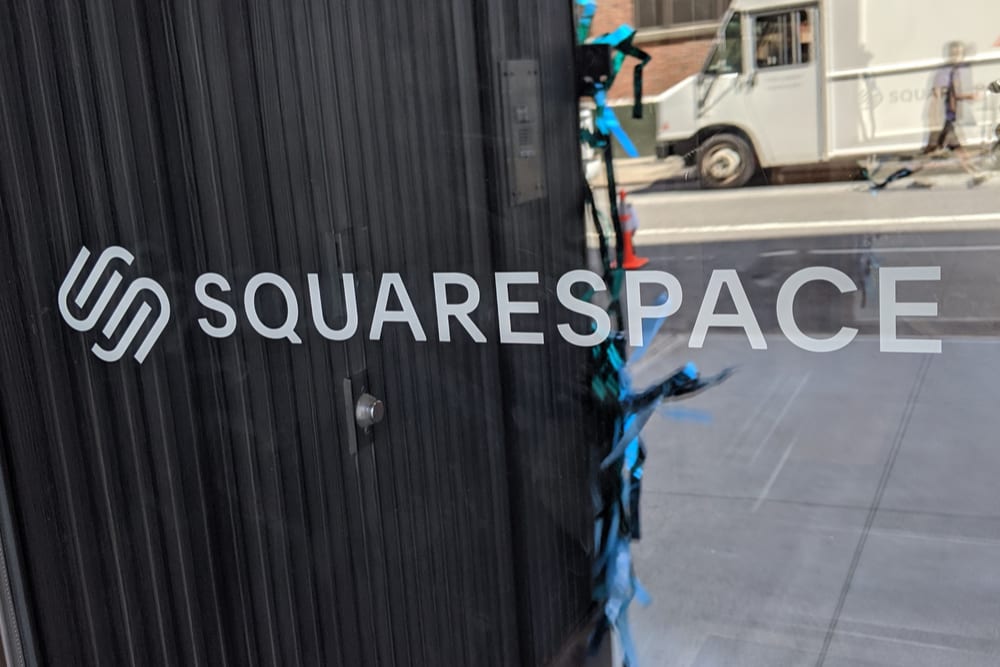
$SQSP Website-hosting service Squarespace Inc. has decided to pursue a direct listing this year (likely in June 2021).
Squarespace direct listing in 2021
Founder and Chief Executive Officer Anthony Casalena, founded Squarespace in 2004 in Baltimore, Maryland. He will continue to control the company through his 76 per cent ownership of the company’s Class B shares, which carry 10 votes each compared with one each for the Class A shares that will be listed.
Squarespace Founder and CEO Anthony Casalena
$SQSP Squarespace revenues grew 28% to $$621M in 2020 with net income of 30M, compared with $58M net income on revenue of US$485M in 2019.
$SQSP revenues have grown dramatically
$SQSP: 94% of the revenues are subscriptions and 70% are annual recurring. It has 3.7M subscribers with an ARPU (Average Revenue Per User) of $187.
They have 84% Gross Margins which grew from 81% a year ago.
Squarespace was valued at $10 billion in a March 2021 funding round, when it raised $300M. It has raised $1B to date since its first round in 2010.
Class A common stock for financial reporting purposes as a weighted-average $63.70 per share for shares granted prior to March 11, 2021.
$SQSP Squarespace competes with publicly traded rivals Wix.com Ltd ($WIX), and GoDaddy Inc., ($GDDY) among others.
Its e-commerce business had 2020 revenue of US$143 million, a 78 per cent increase over the previous year.
Squarespace fastest growing market is Commerce
$SQSP: One of Squarespace’s fastest-growing segments is Commerce, tools that help merchants design an online store to sell physical and digital goods & services. Commerce competes with Shopify ($SHOP) & Big Commerce ($BIGC).
Squarespace has a history of cash generation, including operating cash flow of $102.3 million in 2019 and $150.0 million in 2020. The company’s cash flow data explains why Squarespace is not pursuing a traditional IPO. As Squarespace can self-fund, it does not need to sell shares in its public debut.
Squarespace charges a higher monthly subscription fee for websites that use Commerce, but doesn’t take a cut of the transaction. It does, however, partner with payment processors and receives some of the revenue that Squarespace merchants generate.
Squarespace Commerce launched in 2013, GMV is still growing at 90% YoY – it hit $3.9B in 2020.
Squarespace acquired Tock for more than US$400M in March, which provides technology for online reservations, takeout and other services.
It’s backed by investors including General Atlantic, Index Ventures and Accel.
Valuation: At 28% Growth from 2020, the EV of about $10B and $621M in revenue implies a 16X LTM and at expected 25% growth in 2021 (rough estimates), they will be at $775M in revenue and 12X NTM.
Their valuation will put them in the middle of the pack for valuations among their SaaS peers and at a discount to most others growing at 25-30% if they list at $10B Market Capitalization.
Given that they are profitable, and $30M in net income, the EV/Net income is rich at 333 LTM.
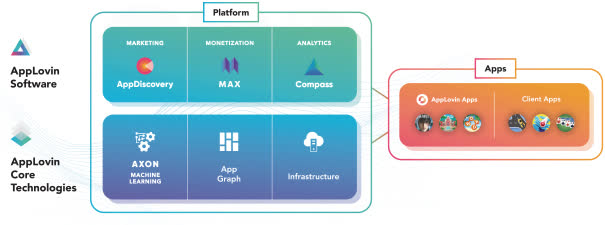
Applovin (NYSE: APP), operates both as: (1) a mobile advertising platform; and (2) a mobile video games publisher
AppLovin is a 2 pronged approach on mobile games and advertising
Background
AppLovin was founded in 2012 by Adam Foroughi, John Krystynak, and Andrew Karam in Palo Alto, California. It counts more than 410M daily active users on its platform, while its apps consist of more than 200 free-to-play mobile games, including Word Connect, Slap Kings and Bingo Story.
In July 2018, AppLovin launched a gaming arm, Lion Studios, and acquired ad bidding company, Max. In February 2021, it agreed to buy Adjust to further expand its technology platform. Adjust makes tools that measure audiences and prevent fraud in mobile advertising.
Market
Applovin appears well-positioned within the fast-growing, $189B mobile app ecosystem, operating at scale in aiding developers to manage, optimize, and analyze their marketing investments to better monetize their apps.
According to IDC, it should grow at a near 11%-CAGR over the next four years, reaching $283B in 2024. The universe of mobile game players exceeds 2B worldwide and includes 1.3M apps.
Mobile Advertising market is $189B in 2020
Industry
The mobile game monetization space is crowded with AdColony, Flurry and InMobi among its closest rivals. There are more than 4.8M mobile apps available on the Apple App Store and Google Play Store.
Mobile advertising ecosystem is very competitive
Product
Applovin’s business model focuses on optimizing the marketing and monetization of apps for both third-party developers and its own mobile games.
Applovin platform and apps
Team
Adam Foroughi is the CEO and co-founder of AppLovin. Herald Chen, is president and chief financial officer.
Andrew Karam, VP of product and co-founder while Katie Jansen, is the chief marketing officer.
Applovin Team
IPO
The AppLovin IPO raised $1.8B, giving it a market capitalization of $28B. Applovin is planning to sell up to 25M shares
Financials
2020 revenue surged by 46% to $1.45B while EBITDA grew 14% to $345M. AppLovin recorded a net loss of more than $125M last year. Cash on hand after IPO should total $2.2B ($1.7B of which is from net IPO proceeds) and there will be $1.7B of debt outstanding.
Valuation
EV/Revenue based on $1.45B in revenue and $28B in Market Cap implies 19X last twelve months and 14 Next twelve months. The stock is down 14% on IPO to $67.
Risks
The ad-tech market is highly competitive and include companies larger than Applovin including $FB and $GOOGL. It is also hard to come up with hit games that consistently engage audiences over time.
Applovin has been growing via acquisitions and integrating them over time will be a challenge. Finally, the dual class stock structure favors the current management team over shareholders.
Recommendation
I already hold $TWTR, $SNAP and $PINS besides $TTD in ad tech, so I am going to pass on $APP for now.


.png)