Collaboration software provider Monday, $MNDY is seeking to IPO in June. The company is has not yet priced its offering and is likely to seek a $3.5B to $4B valuation, raising about $500M at IPO.
Monday $MDNY going public
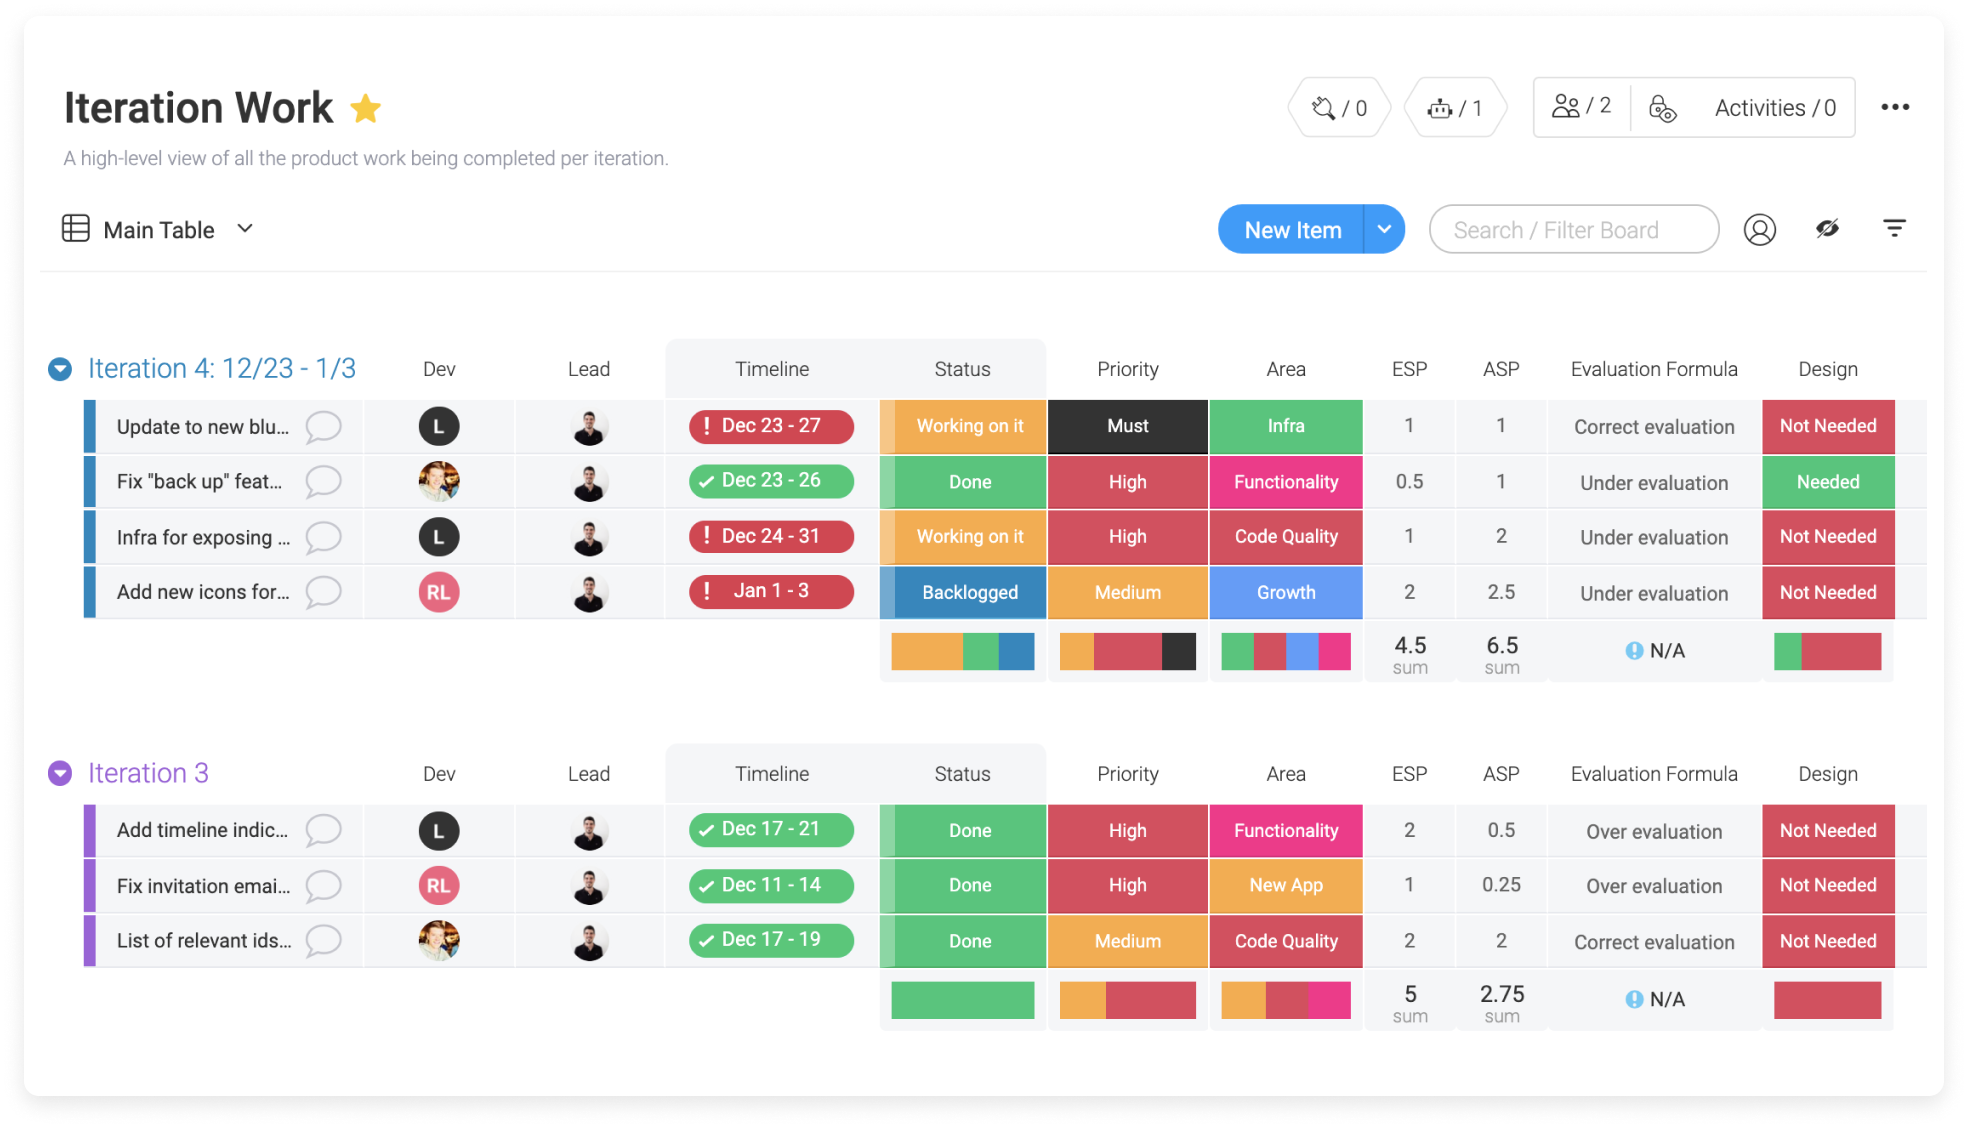
$MNDY Monday was founded in 2012, in Tel Aviv, Israel by Eran Zinman and Roy Man. It is a Software as a Service (SaaS) solution for project management, task management and team collaboration.
The platform is cloud-based, so employees can update the status of projects in real time, yielding a set of dashboards that provide a bird’s-eye view of everything getting accomplished within an organization.
$MDNY Monday has about 800 employees and 128K customers. Its large customers (Spending over $50K annual) are 264 including Universal Music Group, Bayer AG, Mars, Inc, BBC Studios and Nielsen.
$MDNY competes with $WORK / $CRM (Slack/Salesforce), $SMAR (Smartsheet), $TEAM (Atlassian), $ASAN (Asana), Wirke (private), $MSFT (Microsoft Project, Teams) and many other tools.
$MNDY has raised over $235M since 2012 and was last valued in May 2020 at $2.7B.
$MDNY has seen revenues rapidly grow 106% in 2020 to $161M and has grown 86% in Q1 2021 to $59M. It had net losses of $152M in 2020. Sales and Marketing spend is over 100% of revenue. In Q1 2021, for instance, Monday.com generated $59 million in revenue with $63 million in associated sales and marketing costs.
$MDNY investors include Sapphire Ventures, Hamilton Lane, HarbourVest Partners, ION Crossover Partners, Vintage Investment Partners, and Genesis Partners, an Israeli VC.
Valuation
If the IPO were to list Monday.com at $3.5B, then valuation looks reasonable at 21X LTM (2020) and 14X NTM (2021) revenues with 90% growth, since comparable valuations are
$MNDY
$SMAR
$ASAN
Market Cap
$3.5B
$6.5B
$4.8B
2021 Growth (E)
90%
31%
41%
2021 Rev
$242M
$502M
$312M
EV / 2021 Rev
14.4
13.1
15.2
Comparing $MNDY $SMAR and $ASAN
$MNDY Pros:
Revenue growth of over 90% – 100% at $185M revenue run rate
Gross Margins of 84%
DBNER and Net revenue retention rate of 107% (all customers) – 121%(large customers)
$MDNY Cons
Sales and Marketing expense is astonishing and looks unsustainable
Very competitive space with $SMAR $ASAN and $TEAM executing well
Reasonable valuation at 21X Last Twelve Months and 14X Next Twelve Months EV to Revenue for a company growing at 90%
Comparison of Monday, Smartsheet and Asana
Analysis
Strong growth combined with good margins make $MNDY interesting but I am going to wait for 6 months before I jump in.
Confluent, which makes cloud software (open source) Apache Kafka for enterprises filed confidentially for an IPO on April 20th.
Confluent makes Apache Kafka
Confluent CEO Jay Kreps, co-created Kafka with fellow LinkedIn engineers Neha Narkhede and Jun Rao founded it in 2014, in the Bay area (Silicon Valley).
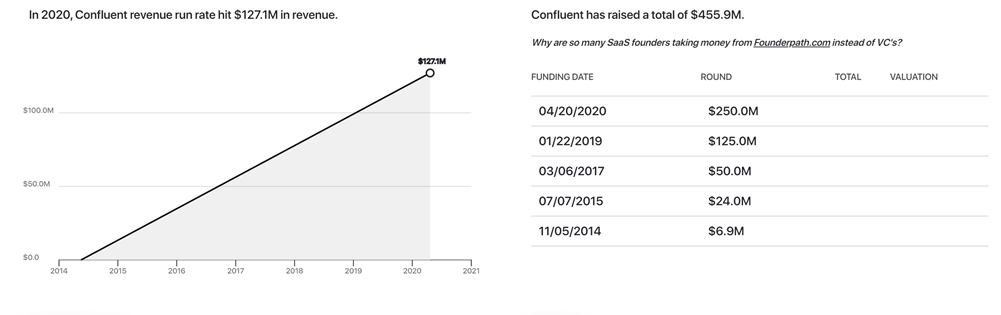
Confluent raised $250M in a Series E round in April 2020, bringing the company’s total funding to $456M. At that time, it was valued at $4.5B.
The company has positioned its Confluent Cloud as a enterprise offering for organizations that want to get value out of a Kafka-based real-time streaming data system, while at the same time continuing to make big engineering investments in the core Kafka software.
What is Confluent?
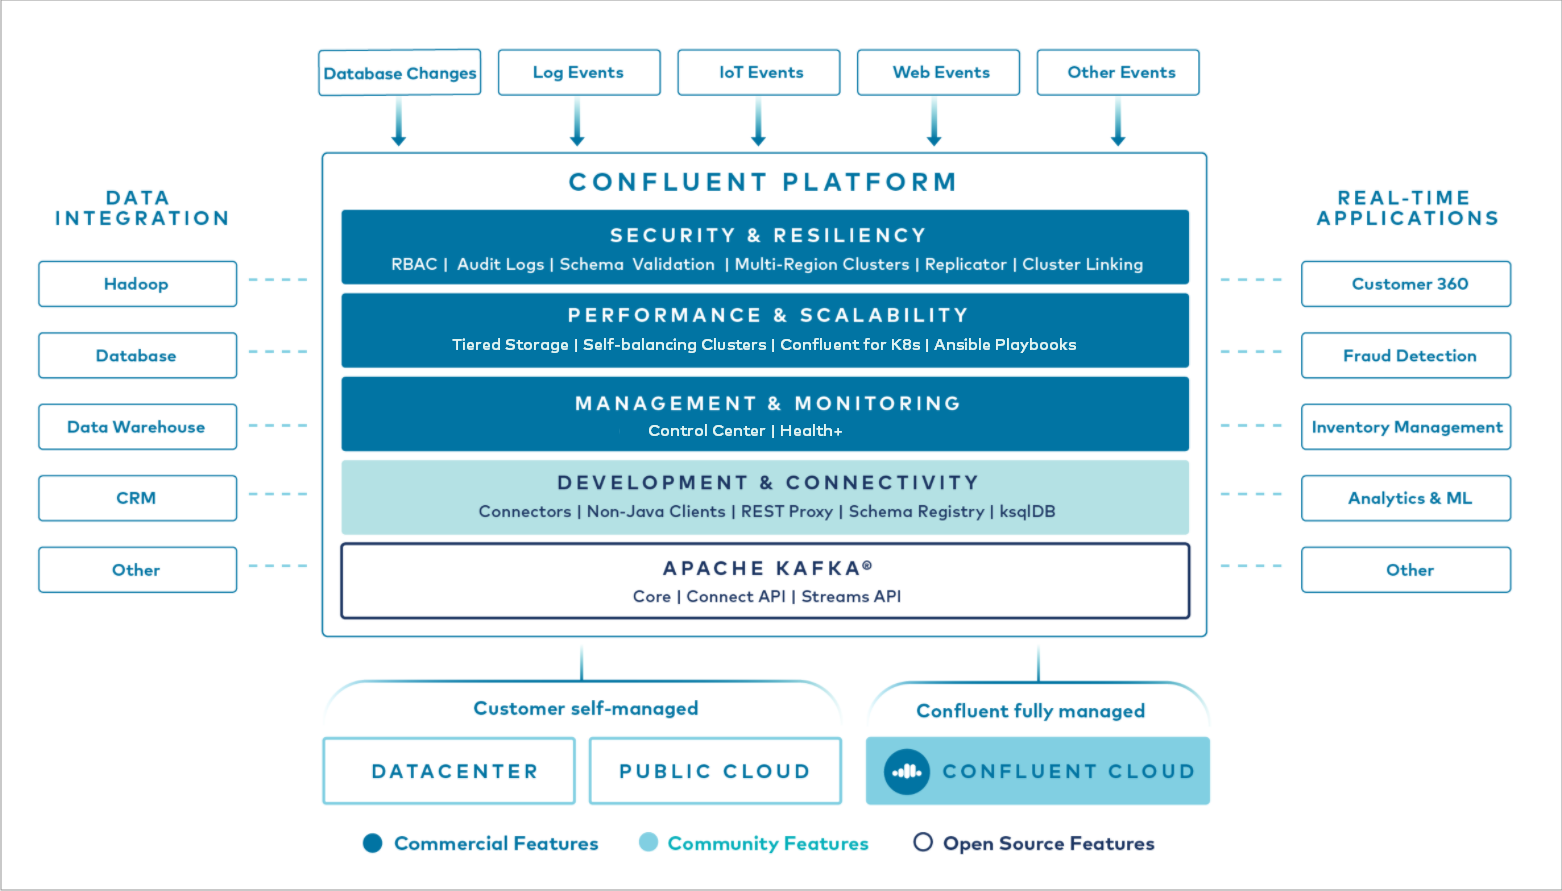
The Confluent Platform is a stream data platform that enables you to organize and manage the massive amounts of data that arrive every second at the doorstep of a wide array of modern organizations in various industries, from retail, logistics, manufacturing, and financial services, to online social networking.
The video below gives you a good overview.
Confluent Platform for real time data
The Confluent Platform is a collection of infrastructure services, tools, and guidelines for making all of your company’s data readily available as Realtime streams.
Confluent takes all real time data and brings it together for analysis
Apache Kafka is a real time, fault tolerant, highly scalable messaging system. It is widely adopted for many use cases ranging from collecting user activity data, logs, application metrics, stock ticker data, and device instrumentation.
Confluence leverages Apache Kafka (open source)
At its core, the Confluent Platform leverages Apache Kafka, a proven open source technology created by the founders of Confluent while at LinkedIn.
Kafka acts as a real time, fault tolerant, highly scalable messaging system and is already widely deployed for use cases ranging from collecting user activity data, system logs, application metrics, stock ticker data, and device instrumentation signals.
Its key strength is its ability to make high volume data available as a real time stream for consumption in systems with very different requirements – from batch systems like Hadoop, to real time systems that require low-latency access, to stream processing engines that transform data streams immediately, as they arrive.
Kafka is deployed at more than 80% of the Fortune 100. Information technology teams use it to stream diagnostics information from data center infrastructure to their monitoring applications.
Marketing departments can harness Kafka to transport website activity metrics to their analytics systems.
Kafka, however is difficult to manage. Confluent’s commercial versions of the platform simplify the task. LinkedIn open-sourced Kafka in 2011, and it quickly gained a foothold in companies like Netflix, Uber and others.
Confluent employs more than 1,400 people at its Mountain View headquarters as well as at offices in San Francisco and India.
Confluent hit $127M in revenue in 2020
Confluent has raised over $456M in funding from venture capital. It reported a run-rate of $207M in 2020 ($17.6M MRR – Monthly Recurring Revenue).
Confluent grew revenues 100%+ in 2019 and over 80% in 2020. While still unprofitable, the company will be looking to raise about $500M by selling shares at $6B – $8B in the public markets, (depending on the market, it might get a lower valuation as well).
For 2021, the estimated revenue is between $310M – $350M, giving it approximately 16X – 23X Enterprise Value to Next Twelve Months Revenue multiple.
$CFLT Updated revenues
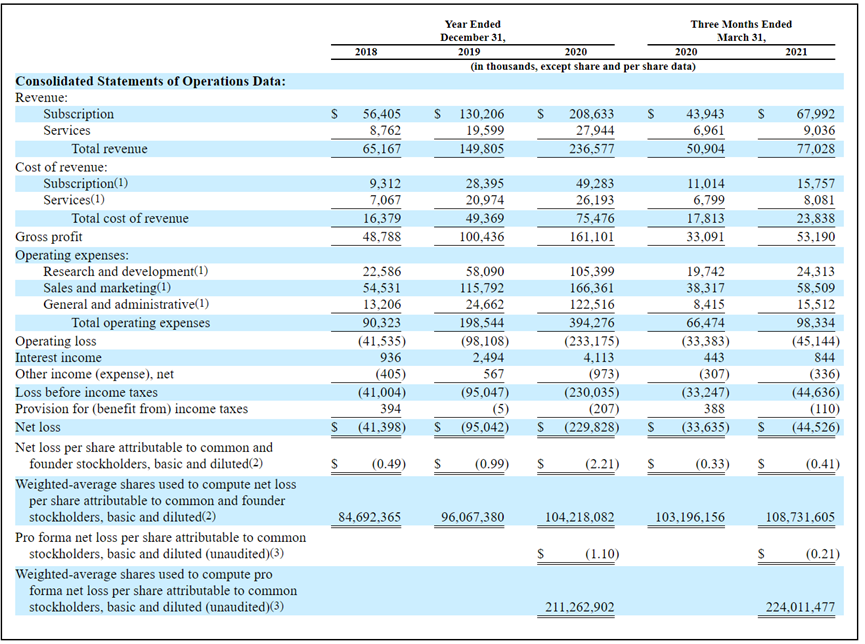
$CFLT Confluent had $208M in 2020 revenues, growing at 51% YoY. Gross Margins were 77% and net losses were $229M.
Global-E Online Ltd. $GLBE, a white-label e-commerce software platform that enables cross-border retail for retailers went IPO at $25, raising $375M at $3.5B Market Cap
The company was founded in 2013 in Israel, by CEO Amir Schlachet, COO Shahar Tamari and CRO Nir Debbi.
Global-E has raised $114M in 6 financing rounds, the most recent of which was last June 2020.
Global-E is a software platform that enables retailers to sell internationally in a seamless, localized shopping experience. Global-E operates largely as a “white label” solution. $GLBE automates local language support, payments, shipping, and website traffic acquisition.
$GLBE has 300 employees, mainly in Israel and the UK. 59% of Global-E’s customers in 2020 were in the UK.
Financials
$GLBE GMV (Gross Merchandise Volume) grew by $211M in 2020 to $774M (+61%) with a $3.9M net profit after a net loss of $7.5M in 2019.
$GLBE 1Q21 guidance implies 130% YoY growth in GMV.
$GLBE revenues were ~$39M, ~$66M, and ~$136M during 2018, 2019, and 2020, implying 70% and 107% YoY growth.
$GLBE gross margin was 22.2%, 28.3%, and 31.9%, during 2018, 2019, and 2020.
$GLBE EBITDA margin was -26%, -7%, and +9%, during 2018, 2019, and 2020.
$GLBE valuation: 11.5x on 2022E revenue and approx. to 35.0x 2022E Gross Profit. This is a good valuation for a company growing at 60% and 172 DBNER.
Business Model
$GLBE business model is a volume-based revenue model, driven by shopper order activity on its merchants’ websites.
$GLBE merchant base has increased from 161 in 2018 to 283 in 2019 and 442 in 2020, implying 175% and 56% YoY growth,
$GLBE DBNER Net Dollar Retention Rate — for the years ended December 31, 2018, 2019, and 2020, NDRR was 153%, 134%, and 172%, respectively.
$GLBE Gross Dollar Retention Rate has stayed over 98% since 2018, implying low churn among existing customers,
In April 2021, Global-E announced an agreement with $SHOP (Shopify) making its platform services available to certain Shopify merchants through Shopify’s e-commerce platform.
$SHOP (Shopify) will receive a take rate off of the GMV transacted via Global-E, and Global-E facilitates cross-border transactions for a select subset of Shopify customers. $SHOP owns >5% of $GLBE.
Approx. 59% of Global-E’s revenues came from the U.K., 25% from North America, ~16% from the European Union countries. Of the 442 merchants on its platform, ~53% were located in the United Kingdom, while 33.0% and ~12% were located in North America and Europe, respectively.
Risks
a) Customer concentration $GLBE largest merchant represented ~20% and 15% of total GMV and generated 25% and 18% of total revenues during 2019 and 2020 respectively.
b) Global-E’s competitive landscape is quite diverse and fragmented from $CRM (Salesforce) to $BIGC (Big Commerce) and $SHOP (Shopify).
c) Long sales cycles: Typically 12 to 16 weeks on average
d) $DHL (DHL) is a large & majority shipping partner (and owns >5% of company).
$GLBE could generate CY21 and CY22 revenues ranging from $220mn to $230mn and $305M to $325M, implying approx. “60%+” and “30%” y/y growth respectively, with gross margin and EBITDA margin approaching ~35% and high teens, respectively, in 2022.
Analysis
While the valuation and business model are attractive the 30% guidance growth for 2022 is not exciting.
I am going to wait for a 3-6 months before I consider a new IPO position in $GLBE.
$PCOR Procore is a software company that provides cloud-based construction management software that will IPO on May 20th, looking to raise $600-$650M at $60 – $65 per share at a Market Cap of $8.3B – $9B, selling 9.5M shares.
Procore App
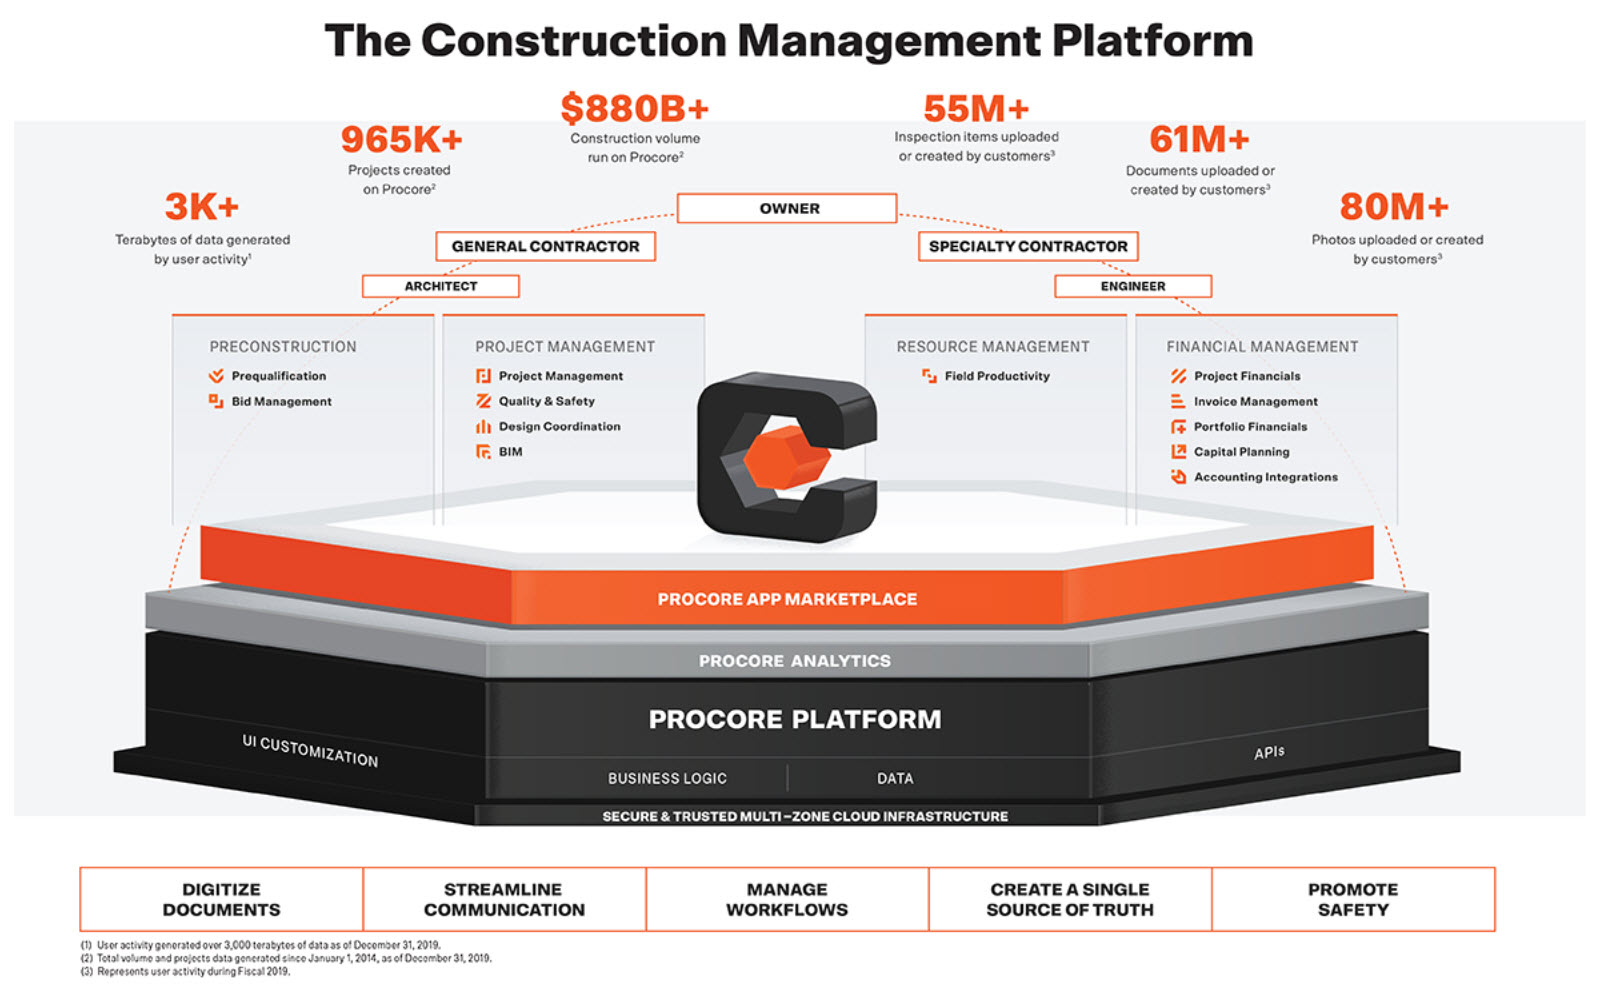
$PCOR provides software to construction companies for project management, construction planning, financial management and resource optimization.
Procore modules
$PCOR was founded in 2003 and is headquartered in California with about 1,900 employees.
Procore headquarters
$PCOR has raised more than $500M from investors including ICONIQ, Bessemer Venture Partners, Dragoneer, Tiger Global, and D1 Capital. Procore was valued at $5.1B as of April 2020.
Procore key metrics
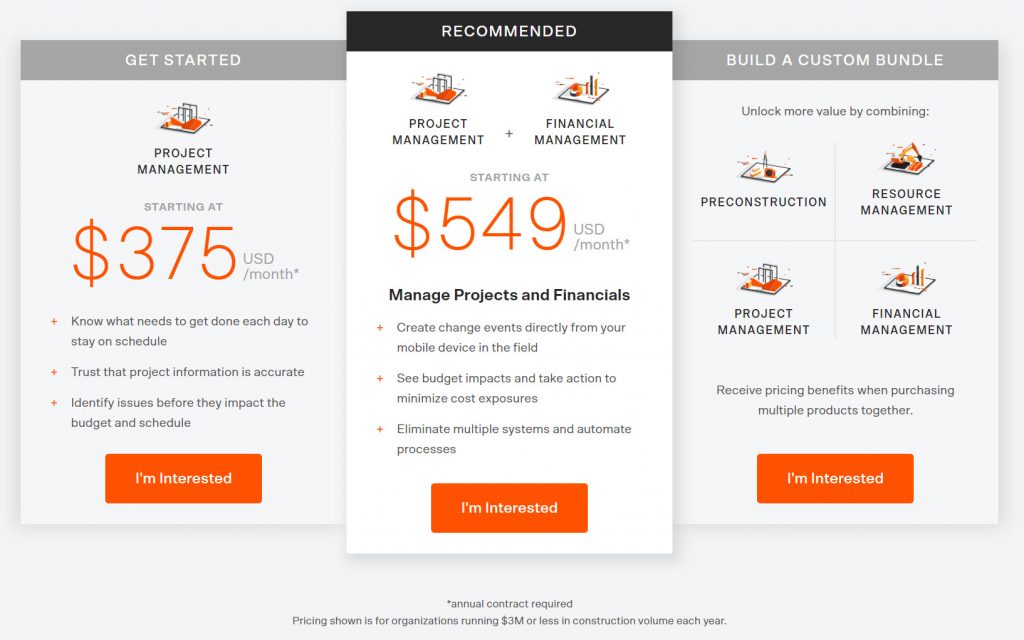
$PCOR prices its products by seat, module and project, which is traditional SaaS (like $CRM).
$PCOR sells to the “Buyer” of the project primarily–the Owner, General Contractor, or sub contractor. Once this project owner pays for the services, all their intra- or inter-enterprise collaborators can use the platform for the duration of the project.
Procore Pricing
Market
Construction is a large $10T market, but the software market is about $3B annually with a very large set of fragmented products and tools.
7% of the world’s workforce is employed in construction.
Metrics
$PCOR revenues for 2021 will likely be $475M (+20% YoY) and valuation is rich at 17X 2021 revenues with low growth.
$PCOR net retention rate was 121% in 2018 and 117% in 2019, but dropped to 107% in 2020.
Gross retention rate through the pandemic was ~95% in 2020, meaning customers reduced spend but did not leave the platform.
2019, $PCOR RPO (Revenue Performance Obligations) was ~$250M and grew to ~$310M at the end of 2020, +23% YoY.
$PCOR has 82%-84% Gross Margin, with 43% spend on Sales and Marketing. Long term operating margins are expected to be 20% -25%.
Pros
Construction industry is fragmented and not digitized yet, so opportunity is large
$PCOR has built a great ecosystem of partners and apps
Growth by acquisitions has been consistent for $PCOR
Cons
Very competitive landscape for construction software with over 100 small companies besides $ADSK, $ORCL
Not a profitable company and $PCOR is losing a lot of cash
Revenue in 2020 decelerated QoQ significantly so this is still a macro economics dependent software company.
Very rich valuation at 17X 2021 revenues at 20% revenue growth YoY and not close to profitable.
Analysis
While I like SaaS companies in general with decent valuations, this is a very easy pass for now, for me. Revenue growth is slow (given the industry) and while it could grow faster in the future, I would like to wait for proof that revenues can grow over 40% before I am willing to jump in at this valuation.
$PCOR – very likely will trade much lower after the first lockup and I see shares going not much higher for 6 months – they might even get to about <$4B valuation ($40 / share) by Dec 2021.
I am watching both Palantir $PLTR and Roblox $RBLX pretty closely to intiate new positions.
$RBLX – Roblox reported a 161% increase in quarterly bookings in the gaming platform company’s first report since going public. Roblox’s gaming activity surged amid the pandemic as more people played games like “Jailbreak” and “MeepCity,” and spent more of the company’s “Robux” digital currency for in-game purchases.
$RBLX
$RBLX posted a $0.46 per share loss on sales of $387M, +140% YoY. Daily active users (DAUs) jumped to 42.1M while users spent 9.7B hours on the platform, up 98% YoY.
$RBLX recorded $652.3 million in bookings, up 161% YoY while the average booking per daily active user was $15.48.
$RBLX managed to launch in China 6-12 months earlier than anticipated.
Roblox
There were some concerns that Roblox’s user growth trajectory would slow meaningfully in early 2021, as kids returned to school, sports, and playdates. That didn’t happen much.
Wall Street analysts believe $RBLX stock is worth roughly $80 today. $RBLX stock is a great long-term investment opportunity to play the “Digi-Everything” megatrend.
What I like about $RBLX is the differentiated segment of users and their increasing engagement (DAU). This company is a cash printing machine.
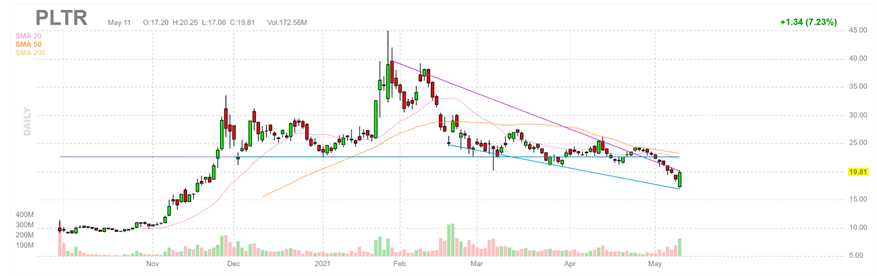
$PLTR Palantir Technologies – The data analytics company matched Wall Street forecasts with quarterly profit of 4 cents per share, while revenue topped estimates. It also said it expected annual revenue growth of 30% or more through 2025.
$PLTR
$PLTR revenue jumped 49% to $341.2M from $229.3M a year ago, well ahead of analysts’ forecasts of $332.2M.
$PLTR U.S. commercial revenue grew 72% year over year, while U.S. government revenue grew 83%.
$PLTR posted a first-quarter loss of $123.5 million, or 7 cents a share, vs. a loss of $54.3 million, or 10 cents a share, in the comparable year-earlier period.
$PLTR said during its earnings call that it will begin accepting bitcoin as a form of payment, and that it may begin holding the crypto on its balance sheet.
“If you take a look at our balance sheet there’s $2.3 billion in cash at quarter-end including $151 million in cash flow in Q1. So it’s definitely on the table from a treasury perspective as well as other investments as we look across our business and beyond,”
CFO David Glazer
Average revenue per customer grew to $8.1M. In its fourth quarter report, the company said average revenue for 2020 came to $7.9M. As of this past quarter, Palantir has 149 customers.
For Q2 2021 $PLTR expects revenue of $360M, +43% YoY, and adjusted operating margin of 23%. For the full year, it expects adjusted free cash flow “in excess of $150M” and annual revenue growth of 30% or greater for 2021 through 2025.
Valuation-wise $PLTR is expensive. The shares trade at about 130X forward looking earnings and at nearly $35B in Market Capitalization about 28X 2021 revenue.
What I like about $PLTR is revenue growth is increasing, commercial customer growth is better (compared to government). The #BTC on balance sheet is interesting, but not very meaningful to my thesis.
$FIGS (Figs Inc) filed to go public last week. The company sells Medical apparel (Scrubs) to professionals online. It is looking to raise about $100M in the IPO, and seeking a valuation of $3.5B to $4B. The final pricing of the stock and expected valuation will be confirmed by June 2021.
FIGS scrubs
$FIGS was founded in 2013 and has raised $75M+ in funding so far. The company did $263M (+131% YoY) in revenue for 2020, with net income of $49M, compared to $112 the year ago.
The founders saw a chance to innovate a sleepy market by using fabrics that were sleek, lightweight, and breathable and by selling direct to consumer, a model that was popularized by Warby Parker.
Its direct-to-consumer (DTC) strategy enables $FIGS to “engage with the medical community of health care professionals before, during and after purchase.”
FIGS co founders and co-CEOs Trina Spear and Heather Hasson
The founders received Ernst and Young Entrepreneur of the Year Award for the Greater Los Angeles Region in 2018 and $FIGS has been a Fast Company “most innovative” company” award winner for years.
Market
For the over 19M healthcare workers in the U.S. (BLS) as of 2017, $FIGS offers stylish (meaning better fit, not loose or baggy), antimicrobial, odor-free and wrinkle-free designs of apparel (called Scrubs).
FIGS Scrubs
Until the late 1980s, scrubs were a business-to-business industry, when hospitals bought on behalf of their staff. Then, budgets were constrained and the hospitals stopped buying them. Doctors and nurses were left picking up the tab.
Medical apparel is now a $10B industry here in the U.S., and a $60B industry worldwide.
Product
$FIGS introduced its direct-to-consumer model with $60-and-up prices, innovative styles and a Silvadur-treated antimicrobial, wrinkle-resistant and odor-free fabric.
$FIGS scrubs retail for $84 / full set — costing multiple times what typical scrubs do, which range from about $10 to $60. But unlike regular scrubs, they’ll last longer as long as they don’t get stained is the company’s claim.
$FIGS scrubs are made with “proprietary fabric technology, called FIONx, (that) offers four-way stretch, anti-odor, anti-wrinkle and moisture-wicking properties,” along with “easy-to-access zippered pockets” to store stethoscopes, scissors, smartphones or ID badges. Designs, fashion and fit are the differentiators as well as materials the Scrubs are made of.
It also sells lifestyle and professional apparel, such as lab coats, outerwear, activewear, loungewear, compression socks, footwear, masks and face shields.
Go to market
Since $FIGS is DTC, they market and sell directly using advertising & social media (Instagram) as their primary vehicle to attract customers. FIGS has cultivated influencers (called ambassadors) who promote its products on social media.
Figs billboards advertise the scrubs with pithy sayings and images that make doctors and nurses look like fashion models.
Medical professionals are advertised as fashion models by FIGS
The hashtag #wearfigs is a rapidly populating stream of posts, with percentage coming from Figs’ official roster of 200 ambassadors who receive free scrubs.
$FIGS Instagram page has over 500K followers showcasing customers—primarily women, who make up 70% of Figs’s customer base—in brightly lit settings, far from the mayhem of an emergency room.
FIGS Instagram page
In 2019 the company also opened a pop-up store in LA.
Awards
Between 2015 and 2018, FIGS reported 9,948% growth, being recognized as Best for the World B-Corp in 2015, as well as ranked Number 21 on Inc. Magazine’s Inc. 5000 ranking of the U.S. fastest-growing companies in 2018.
Competition
$FIGS competes with Strategic partners, Jaanuu and others in this $10B market.
Strategic Partners (SPI), a company that launched in 1995, has been selling in bulk to brick and mortar stores . It is the largest scrubs maker in the world with 40% of the US market via brands like Dickies and Cherokee.
SPI generates about $900M in sales and controls about 40% of the market.
Jaanuu, sells scrubs that look like they could have just come off a runway. Jaanuu was founded in 2013 by Dr. Neela Sethi Young and her brother, private equity investor Shaan Sethi.
Metrics
Last year, Figs’ community of active consumers grew from 600,000 to about 1.3 million, and about 60% were repeat shoppers.
The company’s sales got a boost from the Covid-19 pandemic, during which more hospitals, medical offices and clinics were requiring staff to wear clean scrubs and other medical apparel daily.
Operations
$FIGS has 202 employees and an embroidery workshop and fulfillment center in California, that is operated by a third-party logistics provider. It sources the majority of the fabrics used in its products from two suppliers in China, while other raw materials, such as content labels, elastics, buttons, clasps and drawcords, come from suppliers located predominantly in the Asia-Pacific region.
The company outsources its garment manufacturing operations to factories in Southeast Asia, China and South America.
Risks
$FIGS has benefited from Covid growth, which may taper off. However, the cost of customer acquisition has come down significantly and time to profitable customer is the 1st order.
$FIGS has been accused by Strategic Partners Inc. (SPI) that its business plan was derived from a 300-page confidential report that co-founder Trina Spear filched when she worked as a marketing associate for Blackstone, the private equity company.
SPI — which manufactures and sells scrubs for brands such as Cherokee, Dickies, Elle and Disney — alleges that Spear accessed the company’s business secrets.
SPI, which is owned by private equity firm New Mountain Capital Group, contends Spear shared that information with business partner Hasson and even bragged about it at an event last year in an interview that was posted on YouTube.
There are multiple class action lawsuits on the marketing of its products as “anti-microbial” as well from individual consumers.
$FIGS has been on the receiving end of a poorly executed Ad campaign which accuse the company of being insensitive and stereotyping medical professionals.
The company targets medical students and recent medical college graduates with significant student loans but does not offer financial compensation for their marketing work, instead giving a free pair of scrubs with a suggestion that modeling for FIGS would result in social media popularity.
After addressing the video, FIGS co-founders Heather Hasson and Trina Spear apologized for publishing the video, which they said was “offensive” and “particularly disparaging” to women in medicine.
FIGS – video ad
Valuation
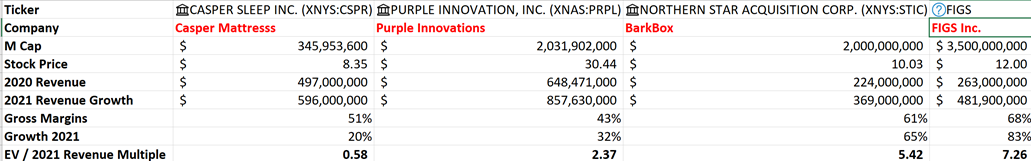
While DTC (direct-to-consumer) peers such as $HNST (Honest Company), $CSPR (Casper Mattress), $PRPL (Purple Innovation) and $STIC / $BARK (Barkbox) are still trading at low (2.5X to 5X 2021 EV/ Revenue) multiples, $FIGS is expecting a 7X – 10X multiple, which makes it expensive.
With 60%+ gross margins, 100% YoY growth and profitable business, however, it is likely to get enough buyers.
FIGS Comparable Multiples and Valuation
Recommendation
Of the multiple new IPO’s, I like $FIGS, since it is similar to $STIC / $BARK – high 60% margins, good growth and profitable.
I will, however wait for a few months to see their execution as a public company before I initiate a position.
$WDH Waterdrop Inc., the Chinese insurance technology company will IPO on May 13th at $10-$12/share raising about $360M, valuing the company at about $4.5B.
$WDH is backed by Tencent $TCEHY which has also backed SEA Limited $SE, Futu Holdings $FUTU among other companies.
Waterdrop distributes insurance policies online and provides illness crowd-funding.
China’s online insurance market, may grow to as much as 2.5 trillion yuan ($387B) in a decade, growing at 16% CAGR, according to China International Capital Corp.
$WDH insurance crowdfunding has more than 70 million users as of 2019 and paid out almost 2 billion yuan to members.
Waterdrop has 2 units – Waterdrop Insurance Marketplace and Medical Crowdfunding.
The company helps those who face significant medical cost conduct crowdfunding campaigns. More than 340 million people donated 37 billion yuan to 1.7 million-plus patients as of the end of last year.
It lost $169M last year on revenues of $464M (+111% YoY). It had $162.8M in cash before the IPO.
The biggest challenges are pending regulatory changes that could halt key operations to prolonged losses if it spends for expansion. Chinese regulators already attempted to block the listing, according to Reuters.
Goldman Sachs (Asia) LLC, Morgan Stanley & Co. LLC and BofA Securities, Inc. are acting as the representatives of the underwriters.
$WDH was founded in 2016, by founder, Chairman and CEO Peng Shen, who was previously a founding team member of Meituan Waimai, a food delivery service in China.
Founder, Peng Shen
Waterdrop has received $741M in investment from investors including Neptune Max, Image Frame Investment, Boyu Capital, Gaorong Capital, and Swiss Re.
$WDH has 62 insurance carriers offering 200 different types of health and life insurance products on its platform
At 10X LTM (but 100%+ growth) and increasing losses, the valuation is very rich compared to recent IPOs of Insure Tech companies in the US – $LMND Lemonade, $OSCR Oscar Health, $ROOT Root Insurance and $RTPZ Hippo Insurance.
$OG Onion Global is a China based online fashion eCommerce marketplace. The company will list on May 11th selling shares at $7.25/share raising about $67.5M at about $600M Market Cap.
$OG management is headed by founder and CEO Cong (Kenny) Li, who was previously founder of another e-commerce company, Hua Ning, and worked at Procter & Gamble China and Nike China.
$OG has received at least $128M from investors including Li Bai Global, Pingsan Bai, YGC Holdings, and ECSH Xianlv Limited.
$OG fresh, fashionable and future brands, which it refers to as the 3Fs across China and parts of Asia.
$OG has about 500K consumers who are influencers, over 2.1M active buyers on the platform & 15.5M registered consumers. They also have more than 4K brands in 24 product categories.
The fashion market they are targeting is a subset of the apparel market focused on influencer-based marketing and is about $18B in Asia Pacific.
$OG had $584M in revenue (+41% YoY) at a Gross Margin of 20%, and grew gross profits 51% YoY to $119M. The operating margin was $39M (+6.7% YoY).
$OG has $40M in cash and will raise another $67M with $6M in Free cash flow for 2020.
At $600M Market cap and $40M in Operating margin they seem reasonably valued, relative to $CPNG, $FTCH and $SE, but $OG has much lower margins.
Recommendation
While I think this is an interesting company with a good brand, I am personally not buying shares at the IPO and have no interest until I see growth in other regions. Fashion as an eCommerce segment has tremendous competition in China as well.
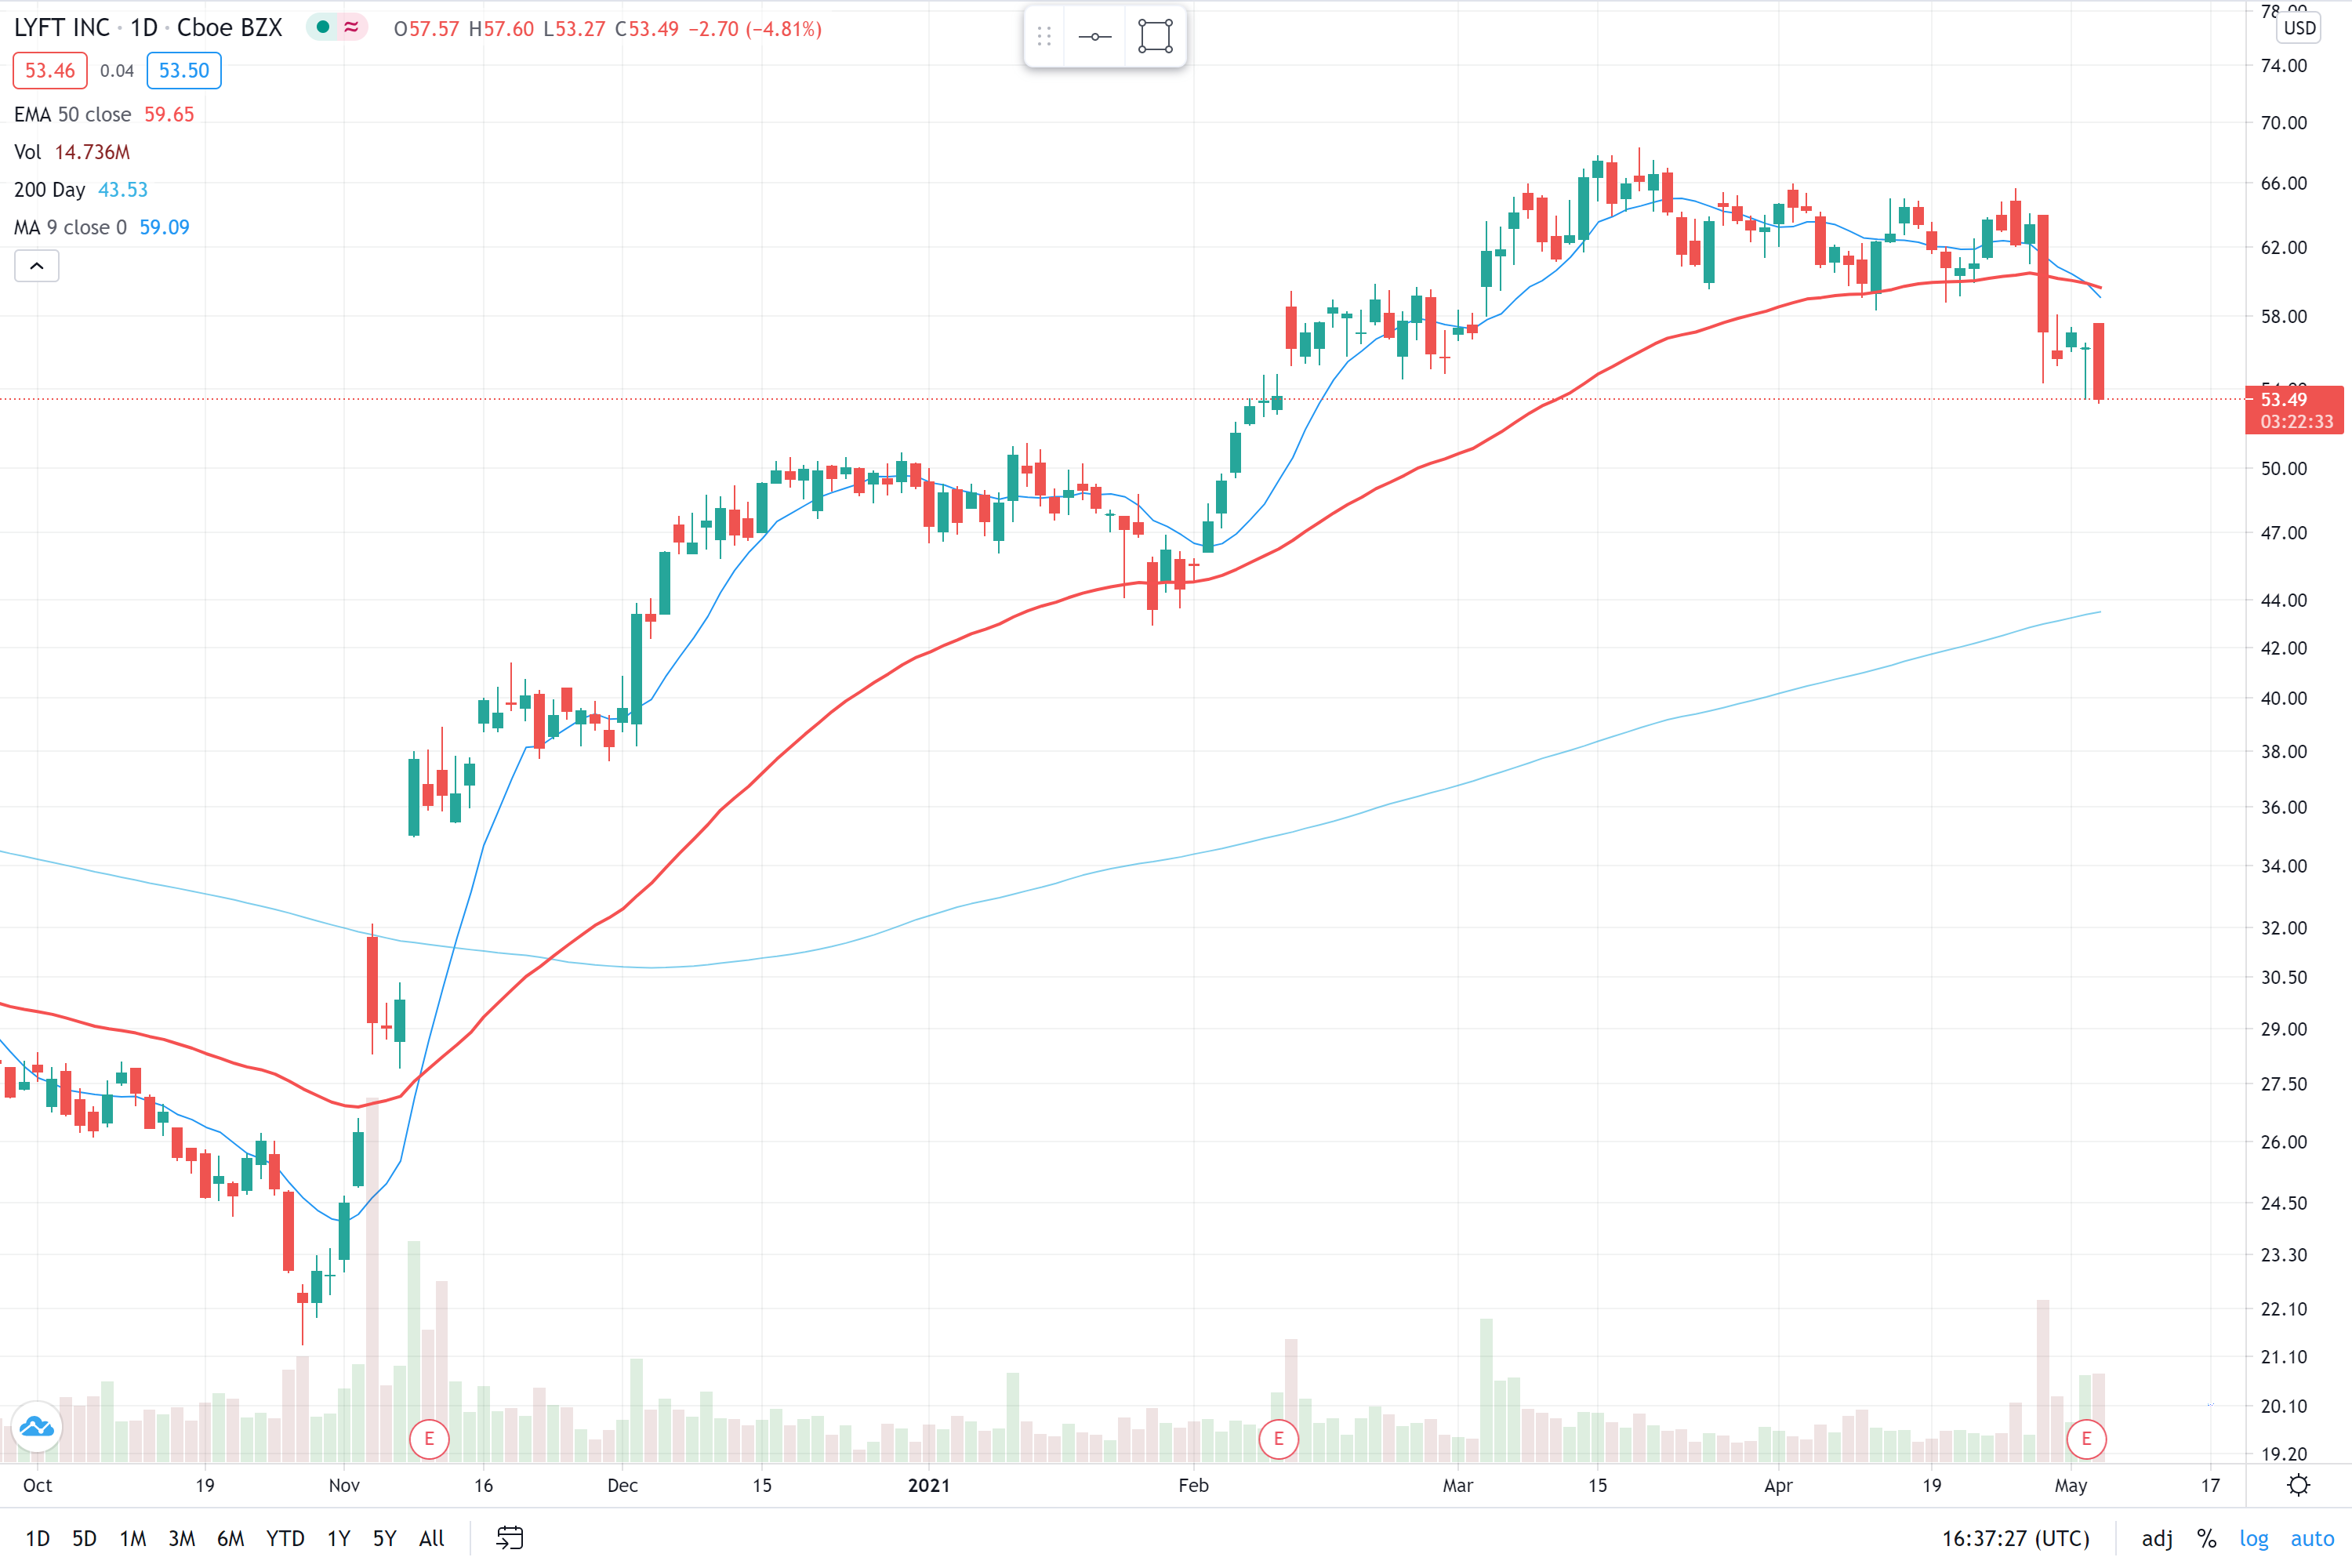
$LYFT $53.48 (-5% on 5/5) slid down after Q1 revenue of $609M (+12% QoQ) and adjusted EBITDA of($73M) – +15% QoQ.
$LYFT believes it can be adjusted EBITDA breakeven by Q2 2021, because of cost cutting measures it adopted post Covid, even with 35% less rides than in 2020.
$LYFT had lower drivers mostly due to Covid vaccinations and federal unemployment benefits, but is seeing ride volume rebound – especially to airports (+65% April relative to Jan).
$LYFT Positives: a) Increased Revenue per active rider (+0.2%) to $45.13 b) Lower costs leading to profitability and c) New offerings in B2B delivery.
$LYFT Negatives: a) Gross margins lower (-4%) thanks to Covid insurance, b) Growth is not as strong as $UBER
Analyst Updates
Deutsche Bank raises PT (Price Target) to $75
Stifel raised PT to $60
Credit Suisse raised PT to $76
Barclays raised PT to $60
Nomura raised PT to $63
Morgan Stanley raised PT to $70
Metrics
Active riders in Q1 went to 13.49M (-36% YoY)
Revenue per active rider in Q1 went to $45.13 (+0.2%)
Recommendation
I dont have a position in $LYFT but see $UBER as a better risk / reward at this point, and will wait until $UBER reports earnings end of day 5/5.
$FLYW Flywire a payment tech company filed to go public privately.
$FLYW Flywire is a global payments company that attracted more than $300M as a startup, most recently raising a $60M in April 2021.
The expected valuation is $3B. $FLYW is looking to raise $100M in its IPO.
The Boston-based company, which was founded in 2011 by Iker focuses on payments in the education, healthcare and travel sectors. The company was initially formed in July 2009 as peerTransfer Corp., but changed its name to Flywire in December 2016.
$FLYW recorded $44.99M in revenue for the three months ended March 31, up from $32.71M in the same period a year ago.
Flywire is working with Goldman Sachs Group Inc and JPMorgan Chase & Co on the listing, which could come as early as July 2021.
$FLYW has processed more than $16B in transactions and employs more than 550 people. Flywire CEO Mike Massaro is focused on growing the company in the education space & travel.
The company processes payments in more than 240 countries and territories worldwide and said it offers over 250 payment methods to its 2,250-plus clients.
2019 calendar year, the company generated revenue of $94.9M and losses of $20.1M.
$FLYW revenue grew to $131.8 million (+39%) with a net loss of $11.1 million (+45%).
Flywire powers more than 50 leading U.S. hospitals and health system & Processes $14 B in patient transactions, representing more than ⅓ of U.S. households.
In Feb 2020, Flywire acquired Simplee, a healthcare technology platform, to optimize the digital payments and patient engagement experience in healthcare and scale its global payments services.
Global payments revenue is expected to grow at a 5.9% CAGR from 2019-2028 to become a $2.5T industry by 2028.


